
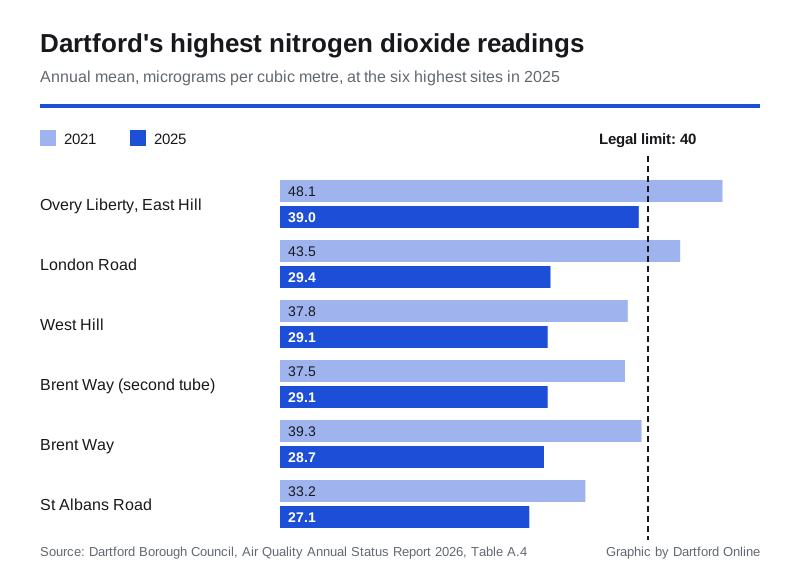
No Dartford monitor broke the nitrogen dioxide limit in 2025, so the council plans to lift its three NO2 zones. East Hill still read 39, against a limit of 40.
Dartford Borough Council wants to scrap all three of its air pollution zones for nitrogen dioxide. Its monitors have stayed under the legal limit for at least three years running.
The zones, known as Air Quality Management Areas, cover the A282 tunnel approach, London Road and Dartford town centre. The first was declared in 2001.
The proposal is in the council’s 2026 Air Quality Annual Status Report, which went to the Overview and Scrutiny Committee on 8 September. It covers readings taken in 2025.
The council cannot do it alone. Its covering report says it “cannot revoke an AQMA without agreement from DEFRA”.
The worst spot got worse
Not every number went the right way. The report says nitrogen dioxide levels in 2025 were “on average slightly higher than in 2024”.
The highest reading in the borough came from a roadside tube at Overy Liberty, on East Hill. It averaged 39 micrograms per cubic metre over 2025. The legal annual limit is 40.
That tube read 35.9 in 2024. It broke the limit in 2021, at 48.1, and again in 2022, at 43.3. The only other tube over 40 in the last five years was on London Road, at 43.5 in 2021.
The council says 39 overstates what residents breathe. The tube sits 0.8 metres from the kerb, and the nearest home is 6.1 metres from it. Corrected for that distance, the report puts the level at the nearest home at 28.9.
It also warns against reading too much into one year. “Annual pollution changes are often a result of weather patterns,” the covering report says.
The three zones
| Zone | Declared | Level when declared | Highest in 2025 | Years under the limit |
|---|---|---|---|---|
| A282 Tunnel Approach | 2001 | 70 | 28.7 (Brent Way) | 3 |
| London Road (A226) | 2006 | 64 | 29.4 | 4 |
| Town centre and approach roads | 2006 | 52 | 39.0 (East Hill) | 3 |
All figures are annual means of nitrogen dioxide in micrograms per cubic metre, from Table 2.1 of the report. That table names Brent Way at 28.7 as the A282 zone’s highest, although the report’s own site list puts a second Brent Way tube, which read 29.1, inside the same zone.
The A282 zone is not being lifted outright. It was also declared in 2001 for PM10 particles, measured over 24 hours. The council does not monitor PM10 inside that zone. It plans a computer modelling review to see whether that part can go too.
For the A282 it leans on National Highways’ own monitors. They sit about three metres from the carriageway, and the report says they have met the limit for three years.
Defra had pushed back a year ago. Its appraisal of the 2025 report, quoted in this one, said none of the zones had been compliant for long enough to be revoked. It said the council “should consider adding additional monitoring locations” at the worst-affected spots in the A282 zone.
Readings across the borough
The council measured nitrogen dioxide at 53 sites in 2025 with small diffusion tubes. It also ran three automatic monitoring stations:
- St Clements, Greenhithe: 22.4, up from 20.7 in 2024
- Bean Lane: 17.4, with less than 75% of the year captured after a long power cut
- Town centre: 23.4, from a new station installed in summer 2025, so only about six months of data
All six of the highest tubes read lower in 2025 than in 2021:
- Overy Liberty, East Hill: 48.1 to 39.0
- London Road: 43.5 to 29.4
- West Hill: 37.8 to 29.1
- Brent Way (second tube): 37.5 to 29.1
- Brent Way: 39.3 to 28.7
- St Albans Road: 33.2 to 27.1
Fine particles are a different story
The Bean station also measures PM2.5, the finest particles. It recorded an annual average of 11 micrograms in 2025, up from 8.0 in 2024.
The report calls that “slightly above the UK target level of 10”. That target, set in 2023 regulations, has to be met by 2040. The Bean figure was estimated from part of the year because of the power cut.
Councils are not required to declare zones for PM2.5. The covering report says it is driven heavily by pollution from outside the area, so local readings can mislead.
What it means for you
For most of Dartford, the air along its busiest roads is measurably cleaner than it was five years ago. At London Road, the reading fell by about a third.
Lifting the zones has a practical side. The covering report says a zone may give the council “enhanced grounds” to require pollution mitigation from developers whose schemes would affect it. Once a zone goes, its action plan stops being a legal requirement. The report says the council must then move to “a broader, long-term strategy” so pollution does not rise again.
If you live near East Hill, the picture is less settled. The tube with the worst record in the borough rose by more than three points last year.
The report also looks ahead to local government reorganisation, which ministers are now reviewing. If Dartford is merged into a new council, Defra will want one air quality report for the whole area. It will accept separate ones during the changeover.
You can read the council’s current action plan and past reports on its air quality page.
Have your say