
The average Dartford home sold for £351,594 in June 2026 (Land Registry). Prices by property type, the priciest streets, and how Dartford compares to Kent.
If you are buying, selling or just keeping an eye on your own street, the question is always the same: what do homes in Dartford actually change hands for? Asking prices in agents’ windows are hopes. The figures that matter are recorded by HM Land Registry when each sale completes, and this page is a plain read of those numbers: the average price, which way it is moving, what each property type costs, the most expensive streets in the borough, and how Dartford sits against Kent and the rest of England.
The headline figure
The average home in the Dartford borough sold for £351,594 in June 2026. That is the provisional figure from the official UK House Price Index, which is built from completed Land Registry sales rather than asking prices.
Over the year to June 2026 prices rose 3.8%, and the month itself added £9,550. That single jump is not a trend: the borough is still £11,209 below its October 2025 level, and May’s figure was originally published as £337,333 before being revised up to £342,044. These local monthly figures bounce around and get revised as late sales are registered, which is why the trend matters more than any single month. We set out the June release in full in Dartford house prices jump £9,550 in a month.
One thing to watch when you compare figures elsewhere. Search Rightmove and you will see an overall Dartford average of about £381,686 for the past year. That is not a contradiction: Rightmove’s “Dartford” is the town listing area, weighted towards houses in DA1 and DA2, while the Land Registry figure covers the whole borough, flats included. Both are real. Always check which patch and which mix of properties a number describes before you lean on it.
What it means for you
If you are selling, one strong month does not mean buyers have stopped comparing hard, and overpriced homes still sit. Sold-price data compiled by Property Solvers puts the average time to sell in Dartford at around 116 days, with homes going for roughly £12,000 under the asking price on average, so realistic pricing from day one is what actually moves a sale. If you are buying, that same gap is your negotiating room. And whatever you buy, check the council tax band before you offer, because that yearly bill runs with the property, not the price.
Prices by property type
The borough average hides a wide spread. These are the Dartford averages for June 2026 from the UK House Price Index:
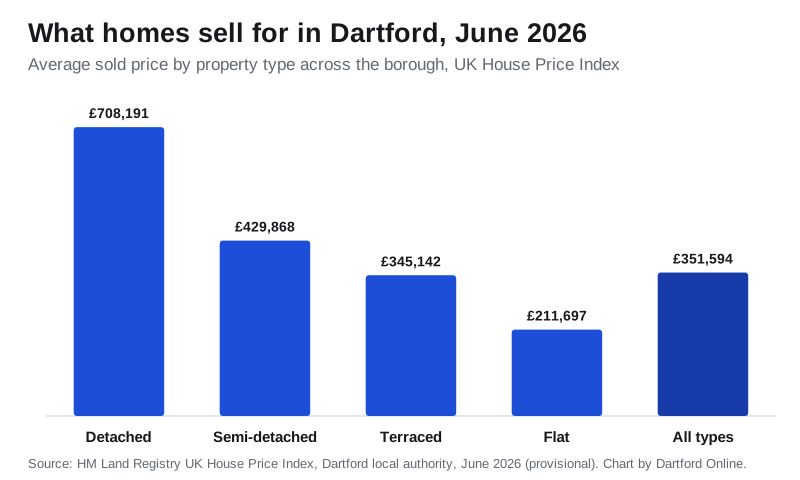
- Detached houses: £708,191, up 3.0% over the year. The top of the local market, concentrated in roads like those around Wilmington and Darenth.
- Semi-detached houses: £429,868, up 4.8%, the fastest riser in the borough.
- Terraced houses: £345,142, up 4.7% and the backbone of the town’s Victorian streets.
- Flats and maisonettes: £211,697, up 2.1%, the slowest riser and still the cheapest way in.
Every type is up over the year, but not evenly. Semi-detached and terraced homes are climbing at more than twice the rate of flats, which is the pattern across the wider south east: flat buyers are the most exposed to mortgage rates.
First-time buyers and home movers
The same data splits buyers usefully. A first-time buyer in Dartford paid an average of £306,004 in June 2026; a home mover, selling one property to buy another, paid £437,247. The £131,000 gap is, in effect, the price of the step up from a first flat or terrace to a family house in this borough. The first-time buyer average matters for another reason: stamp duty relief for first-time buyers is nil up to £300,000 and 5% above it.
The most expensive streets
Dartford is one of Kent’s more affordable boroughs, but it has genuine top-end pockets. From sold-price records compiled by Property Solvers, the priciest streets by recent average sale are:
- Coopers Drive (DA2), around £977,000
- Caswallen Close (DA2), around £896,000
- Shepherds Lane (DA1), around £862,000
- Dartford Road (DA1), around £837,000
- Swaisland Road (DA1), around £750,000
Individual sales run far higher. The borough’s biggest recorded sale is £7,843,000 for 63 Station Road in 2023, and roads such as Rowhill Road and Birchwood Road on the rural western edge have logged repeated sales around and above £2 million, according to Land Registry records compiled by House Price Watch. Out in the villages, Plumplot’s postcode analysis puts the DA4 sector around Sutton-at-Hone and South Darenth at an average of about £599,000, the highest in the DA area.
How Dartford compares to Kent and England
| Area | Average price | Annual change |
|---|---|---|
| Dartford borough | £351,594 | +3.8% |
| Kent (county council area) | £346,118 | +2.1% |
| South East region | £380,380 | +0.3% |
| England | £293,262 | +1.8% |
After June’s jump Dartford sits just above the Kent average and about £29,000 below the South East, while being roughly £58,000 above the England average. For a borough with direct trains into central London in under 40 minutes, that relative affordability is the whole pitch, and it is why so many buyers arrive from London and from pricier neighbours. On Plumplot’s affordability measure, the median Dartford home cost 8.3 times median earnings in 2024, above the England and Wales figure of 7.54 but below both Gravesham (9.3) and Bexley (9.4) next door.
One local factor to keep in mind: a large share of the borough’s new supply is being built at Ebbsfleet Garden City, where the Ebbsfleet Development Corporation is delivering up to 15,000 homes across parts of Dartford and Gravesham. A steady pipeline of new-build homes gives buyers alternatives, which is one reason the resale market here rewards sensible pricing. The schemes reshaping the borough are covered in our Dartford planning news page.
Frequently asked questions
What is the average house price in Dartford?
The average home in the Dartford borough sold for £351,594 in June 2026, according to the provisional UK House Price Index built from HM Land Registry completed sales. Averages quoted for the town listing area alone are higher, around £382,000 on Rightmove.
Are Dartford house prices going up or down in 2026?
Up, after a flat spring. The year to June 2026 showed a rise of 3.8%, and June alone added £9,550 to the average. The borough is still £11,209 below its October 2025 level, so this is a recovery in progress rather than a boom.
How much is a detached house in Dartford?
A detached house averaged about £708,000 in June 2026, roughly £278,000 more than the average semi-detached home in the borough.
Is Dartford cheaper than the rest of Kent?
Not any more, narrowly. After June’s rise Dartford’s £351,594 average sits just above the Kent county average of £346,118, though still well below the South East average of £380,380. That gap to the wider region is unusual for a borough this close to London and a big part of its appeal to commuters.
Where are the most expensive houses in Dartford?
The priciest streets by average sale are Coopers Drive and Caswallen Close in DA2 and Shepherds Lane in DA1, with repeated £2 million-plus sales on Rowhill Road and Birchwood Road and a record £7.8 million sale on Station Road in 2023.
Where can I check what a specific house sold for?
Every completed sale in England and Wales is public. Look up any street or address free on the HM Land Registry sold-price search, or browse the same data on Rightmove and Zoopla.
Sources
- UK House Price Index, Dartford (ONS / HM Land Registry) for the borough average, property-type and buyer-type figures
- UK House Price Index open data for the Kent, South East and England comparators (June 2026)
- Property Solvers Dartford house prices for selling times, asking-to-sold gap and the most expensive streets
- House Price Watch Dartford for the highest individual sales
- Plumplot Dartford house prices for postcode-sector and affordability analysis
- Rightmove Dartford sold prices for town-area market context
- Ebbsfleet Garden City for the new-build pipeline
- HM Land Registry sold-price search to check any individual address
Land Registry figures are provisional and revised as more sales complete. Checked August 2026; always confirm the latest numbers against the linked sources before making a decision. New to the borough? Our guides to Dartford council tax bands, bin collection days and parking in Dartford cover the practical side of moving here.
Have your say