
The average Dartford home reached £351,594 in June, up £9,550 in a month, the 8th biggest rise of 295 English areas. Sales, though, keep falling.
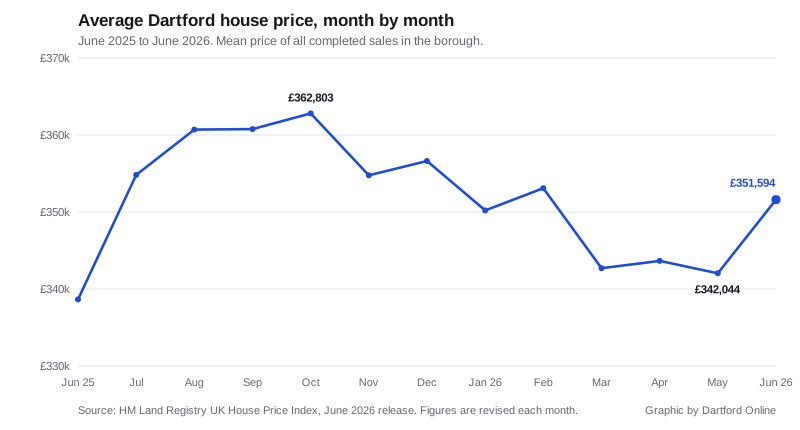
The average home in the Dartford borough sold for £351,594 in June, up £9,550 on May. It is the borough’s biggest one-month rise since July last year, and it turns a spring of falling prices into an annual increase of 3.8 per cent. (HM Land Registry UK House Price Index, June 2026)
The figures were published on 19 August in the monthly UK House Price Index, the official measure built from completed Land Registry sales rather than asking prices. July’s figures are due at 9.30am on Wednesday 16 September.
Dartford’s 2.8 per cent monthly rise was the eighth largest of the 295 local authority districts in England. Only City of London, Slough, Newcastle-under-Lyme, Burnley, Kingston upon Thames, Lancaster and South Cambridgeshire moved further in a single month. That comparison comes from the index’s full data file, which carries every area and every month in one download. (UK HPI full file, June 2026)
One month does not undo the year
A single jump is not a recovery, and the chart is the honest version of this story. At £351,594 the borough is still £11,209 below its October 2025 level of £362,803. Prices fell in three of the six months before June.
Summer strength is not new here either. Dartford’s average rose in July in each of the last three years, by 2.9 per cent in 2023, 1.8 per cent in 2024 and 4.8 per cent in 2025. This year the lift arrived a month earlier.
The index is also revised every month as more completed sales are recorded. May is a good example:
- when first published, May read £337,333, a fall of 0.8 per cent on the year
- in this month’s release May has been restated at £342,044, a rise of 0.6 per cent
- that is £4,711 added to the average, and a sign change on the annual figure
The Land Registry treats the two most recent months as provisional for exactly this reason. (About the UK House Price Index)
What each type of home costs
June’s average by property type, with the change on June 2025:
- Detached: £708,191, up 3.0 per cent
- Semi-detached: £429,868, up 4.8 per cent
- Terraced: £345,142, up 4.7 per cent
- Flat: £211,697, up 2.1 per cent
The gap between a flat and a detached house in the borough is now just under half a million pounds. Semi-detached and terraced homes, the bulk of Dartford’s housing stock, are the two types rising fastest.
First-time buyers are back over £300,000
The index runs a separate average for first-time buyers, and in Dartford it reached £306,004 in June, up 4.0 per cent on the year. It had spent three months below the £300,000 mark: £297,946 in March, £298,974 in April and £297,616 in May.
How Dartford compares in Kent
Annual change to June 2026 across Kent’s districts, Medway and the county as a whole:
| Area | Average price | Change on the year |
|---|---|---|
| Dover | £276,234 | +4.5% |
| Swale | £298,394 | +4.5% |
| Dartford | £351,594 | +3.8% |
| Canterbury | £338,030 | +3.3% |
| Sevenoaks | £543,081 | +3.2% |
| Tonbridge and Malling | £405,932 | +2.6% |
| Folkestone and Hythe | £304,717 | +2.4% |
| Gravesham | £345,369 | +2.4% |
| Kent (county) | £346,118 | +2.1% |
| Medway | £296,182 | +1.1% |
| Thanet | £268,760 | +0.9% |
| Ashford | £344,332 | +0.3% |
| Maidstone | £352,191 | +0.1% |
| Tunbridge Wells | £445,133 | -3.0% |
Dartford has the third strongest annual rise in the county and now sits above the Kent average of £346,118. Across the river, Thurrock averaged £327,176, up 2.3 per cent. Next door in Bexley the average was £405,477, up 1.2 per cent. London as a whole fell 2.5 per cent to £553,870.
Nationally Dartford is less of an outlier than that eighth place suggests. Its 3.8 per cent annual rise ranks 114th of the 295 English districts, against 1.8 per cent for England and 0.3 per cent for the South East.
Fewer people are actually moving
Prices are only half of the picture. The index also counts completed sales, and Dartford’s are down:
| Month | Sales 2025 | Sales 2026 |
|---|---|---|
| January | 138 | 86 |
| February | 118 | 104 |
| March | 301 | 98 |
| April | 53 | 79 |
That March 2025 spike, and the collapse the month after, are the stamp duty threshold change of 1 April 2025 pulling completions forward. Comparing March or April on its own tells you nothing. Take the four months together and Dartford recorded 367 sales in 2026 against 610 in 2025.
Sales figures lag prices by about two months, so April is the most recent month the Land Registry publishes for the borough. May and June are blank in the data.
What it means for you
- If you are selling, the June figure is provisional and will move. Price against completed sales on your own street, not a borough mean.
- If you are buying, semi-detached and terraced homes are the two types climbing fastest here, at close to 5 per cent a year. Flats are rising at less than half that rate.
- If you are a first-time buyer, the borough average for your bracket has crossed back over £300,000. First-time buyer stamp duty relief pays nothing up to £300,000 and 5 per cent on the slice above it, and disappears entirely on a purchase over £500,000. (HMRC stamp duty rates)
- Everyone should read the average carefully. UKHPI publishes a mean, not a median. A handful of expensive sales pulls it up, which is one reason a single month can move nearly £10,000.
Our Dartford house prices page sets out the longer picture, including prices by street and how the borough compares with England. If you are working out the running costs of a move, the Dartford council tax bands page has this year’s charges for every band.
Sources
- HM Land Registry UK House Price Index, Dartford, June 2026 release
- UK HPI full data file, June 2026, used for the Kent, national and ranking comparisons
- About the UK House Price Index, on revisions and what the index measures
Have your say