
The average Dartford home is £347,773, down £7,043 in a year. That is the biggest annual fall of any council area in Kent, and flats dropped 4.7 per cent.
The average home in the Dartford borough was worth £347,773 in July, down £7,043 on July last year. That is a fall of 2.0 per cent, and it is the biggest annual drop of any council area in Kent. (HM Land Registry UK House Price Index, July 2026)
The figures were published on 16 September in the monthly UK House Price Index. It is the official measure, built from completed Land Registry sales rather than asking prices. (UK House Price Index for July 2026)
Only one other Kent council area recorded any fall at all. Maidstone was down 0.1 per cent. Every other district in the county went up.
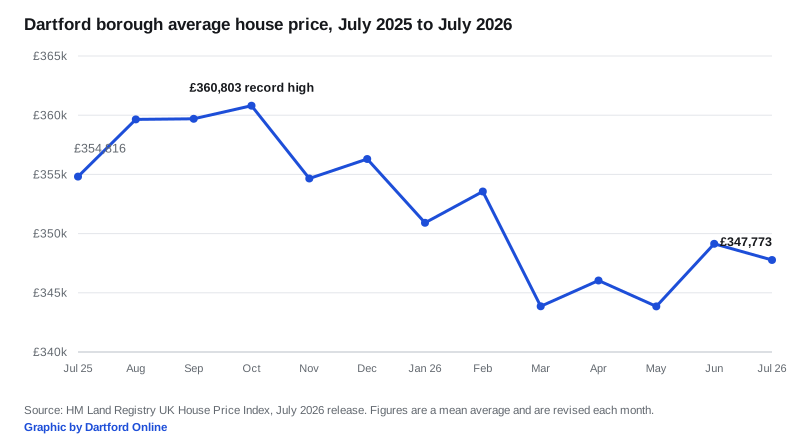
The 2 per cent fall is mostly about last July, not this one
Prices in Dartford barely moved between June and July. The average slipped £1,368, or 0.4 per cent.
What changed was the month it is being compared against. July 2025 was a freak month in this borough. The average jumped 4.8 per cent in four weeks, from £338,647 to £354,816. That is the largest one-month rise Dartford has recorded in at least ten years.
So the annual figure is measuring today against an unusually high base. It swung from plus 3.1 per cent in June to minus 2.0 per cent in July while the actual price moved by less than half a per cent. Readers should treat the headline percentage with that in mind.
The longer trend is easier to read, and it is a slow decline:
- the borough’s record average was £360,803 in October 2025
- July’s £347,773 is £13,030 below that peak
- prices have fallen in five of the nine months since
June has already been revised down
The index restates recent months as more completed sales are registered, and last month’s release has been corrected.
- when we reported June, it read £351,594, an annual rise of 3.8 per cent
- in this release June has been restated at £349,141, a rise of 3.1 per cent
- October 2025’s record has also been trimmed, from £362,803 to £360,803
The Land Registry treats the two most recent months as provisional for exactly this reason. (About the UK House Price Index)
Flats are taking the hit
July’s average by property type, with the change on July 2025:
| Type of home | Average price | Change on the year |
|---|---|---|
| Detached | £701,709 | -1.9% |
| Semi-detached | £426,483 | -0.5% |
| Terraced | £342,398 | -1.1% |
| Flat | £207,478 | -4.7% |
Flats are falling nine times faster than semi-detached houses. The borough’s flat average is also falling faster than the Kent flat average, which is down 1.6 per cent, and faster than Bexley’s, down 0.7 per cent.
Semi-detached homes, the most common type in much of the borough, are close to flat at minus 0.5 per cent.
How Dartford compares
Annual change to July 2026 across Kent’s districts, Medway and the county as a whole:
| Area | Average price | Change on the year |
|---|---|---|
| Gravesham | £344,923 | +3.3% |
| Swale | £298,985 | +3.2% |
| Canterbury | £337,454 | +2.9% |
| Dover | £277,750 | +2.7% |
| Thanet | £269,708 | +1.8% |
| Kent (county) | £346,904 | +1.5% |
| Tonbridge and Malling | £407,880 | +1.4% |
| Ashford | £347,562 | +1.4% |
| Medway | £298,547 | +1.1% |
| Sevenoaks | £538,714 | +1.0% |
| Folkestone and Hythe | £303,296 | +0.9% |
| Tunbridge Wells | £456,227 | +0.6% |
| Maidstone | £352,722 | -0.1% |
| Dartford | £347,773 | -2.0% |
Next door in Gravesham, prices rose 3.3 per cent, the strongest in the county. Across the river in Thurrock they fell 0.9 per cent. In Bexley they rose 2.0 per cent to £413,343.
Dartford’s annual change ranks 260th of the 295 local authority districts in England. That comparison comes from the index’s full data file, which carries every area and every month in one download. (UK HPI full file, July 2026)
England as a whole rose 1.1 per cent to £293,479. The South East was almost static at plus 0.2 per cent. London fell 3.3 per cent.
First-time buyers
The index runs a separate average for first-time buyers. In Dartford it was £302,473 in July, down 2.0 per cent on the year.
It has hovered just either side of the £300,000 mark all year: £298,887 in March, £300,909 in April, £298,996 in May. That threshold matters, because first-time buyer stamp duty relief pays nothing up to £300,000 and 5 per cent on the slice above it. (HMRC stamp duty rates)
What it means for you
- If you are selling, ignore the 2 per cent headline and look at the monthly line. Prices here have been drifting down slowly since last autumn, not dropping suddenly. Price against completed sales on your own street.
- If you are buying a flat, you have more room than at any point in the last year. Flats are the only type in the borough falling by more than 2 per cent.
- If you are a first-time buyer, the borough average for your bracket is £2,473 above the stamp duty relief threshold. On a £302,473 purchase the relief means £123 of duty rather than the £5,123 a mover would pay.
- Read the average carefully. UKHPI publishes a mean, not a median. A handful of expensive sales pulls it up, and a quiet month for large detached homes pulls it down.
- The next figures are already dated. August’s data is published at 9.30am on Wednesday 21 October, and it will revise July again.
Our Dartford house prices page sets out the longer picture and how the borough compares with England. If you are working out the running costs of a move, the Dartford council tax bands page has this year’s charges for every band, and bin collection days are listed by street.
Sources
- HM Land Registry UK House Price Index, Dartford, July 2026 release
- UK House Price Index for July 2026, published 16 September 2026
- UK HPI full data file, July 2026, used for the Kent, national and ranking comparisons
- About the UK House Price Index, on revisions and what the index measures
Have your say